Monthly Sales Report
Monthly sales report using Power BI to track trends and seasonal patterns.
🇧🇷 Ler em Português.
Monthly Sales Report
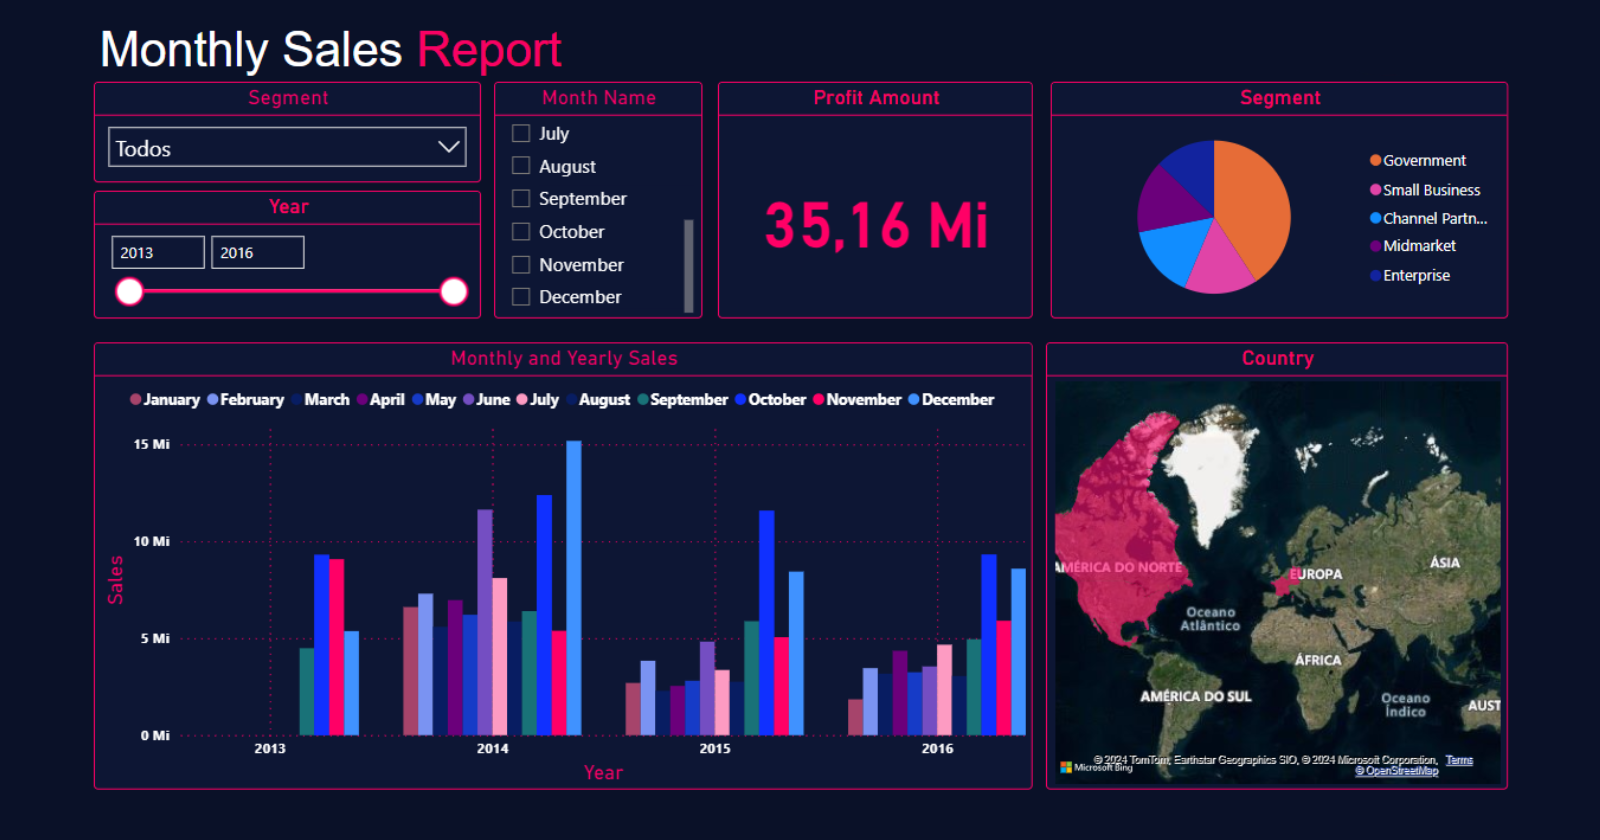
This interactive sales report was developed using Microsoft Power BI and powered by an Excel-based data source, with the goal of analyzing monthly sales trends across multiple years. By leveraging data visualization tools and advanced analytics features in Power BI, it became possible to identify seasonal sales patterns, uncovering insights into sales fluctuations throughout the year.
The analysis highlights low-performance months, helping businesses to optimize sales strategies and enhance decision-making in order to increase revenue during low-demand periods. Understanding when sales typically drop enables proactive planning and smarter resource allocation.
This Power BI dashboard serves as a valuable tool for companies seeking to improve business intelligence, make data-driven decisions, and boost overall sales performance by using historical data to forecast and enhance future outcomes.
Related Content

If you find this post helpful, please consider sharing 💜