Car Dashboard

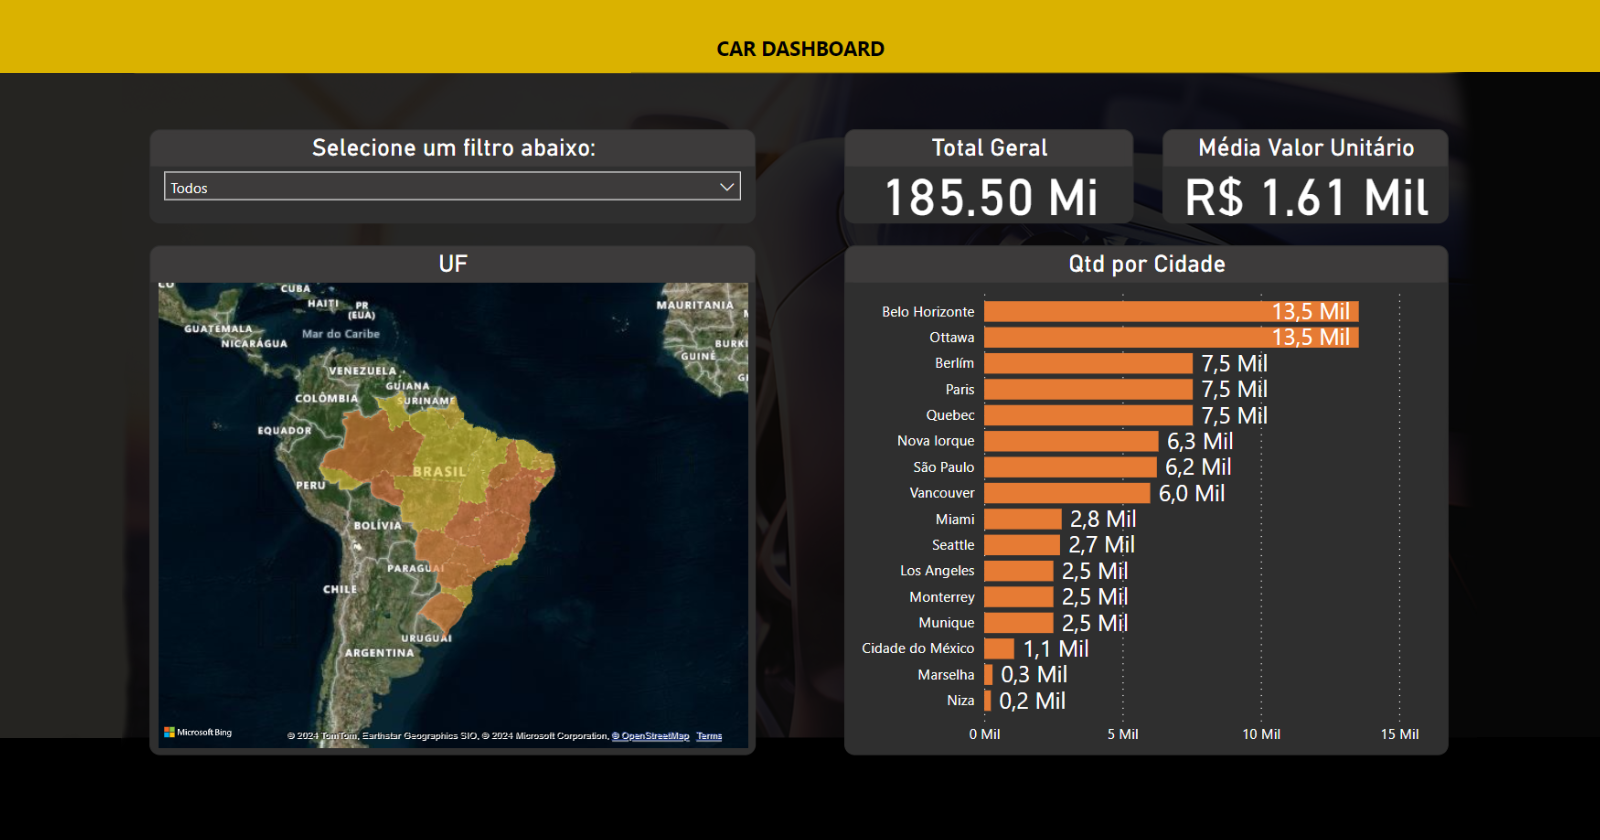
Car sales dashboard using Power BI and Excel for regional performance insights.
🇧🇷 Ler em Português.
iWant 2.0
This interactive car sales dashboard was created using Microsoft Power BI, with data sourced from an Excel spreadsheet, to analyze the number of vehicles sold across different regions. The report features dynamic filtering capabilities by location, allowing users to identify sales performance patterns and detect underperforming areas in terms of vehicle sales.
By leveraging data visualization and real-time insights, this dashboard empowers companies to make strategic, data-driven decisions that help optimize marketing and sales efforts in low-performing regions. This targeted approach contributes directly to improved sales outcomes and better allocation of commercial resources.
Tools like Power BI and Excel are essential components of modern business intelligence, enabling organizations to transform raw data into actionable insights and drive performance through informed decision-making.
Related Content

If you find this post helpful, please consider sharing 💜
